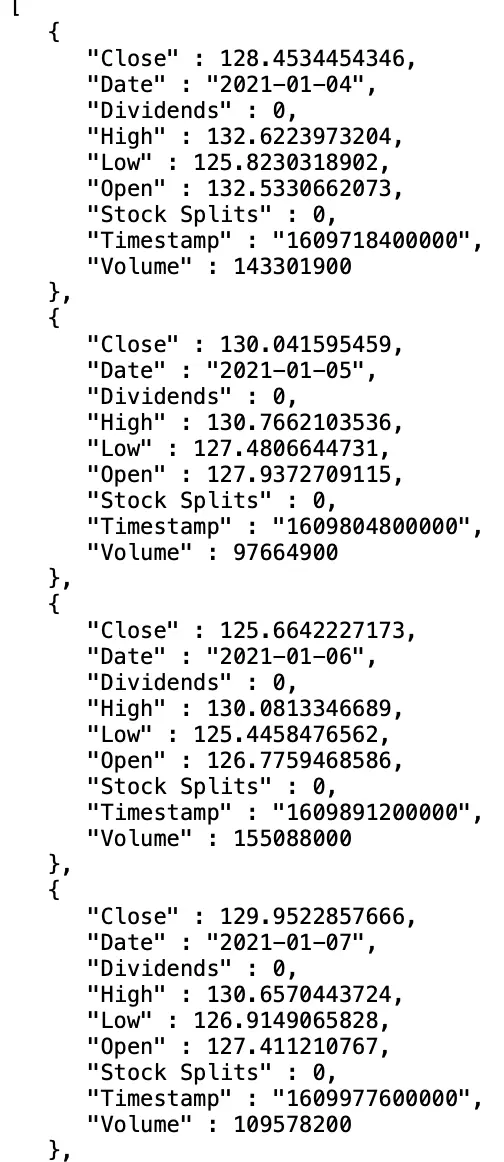
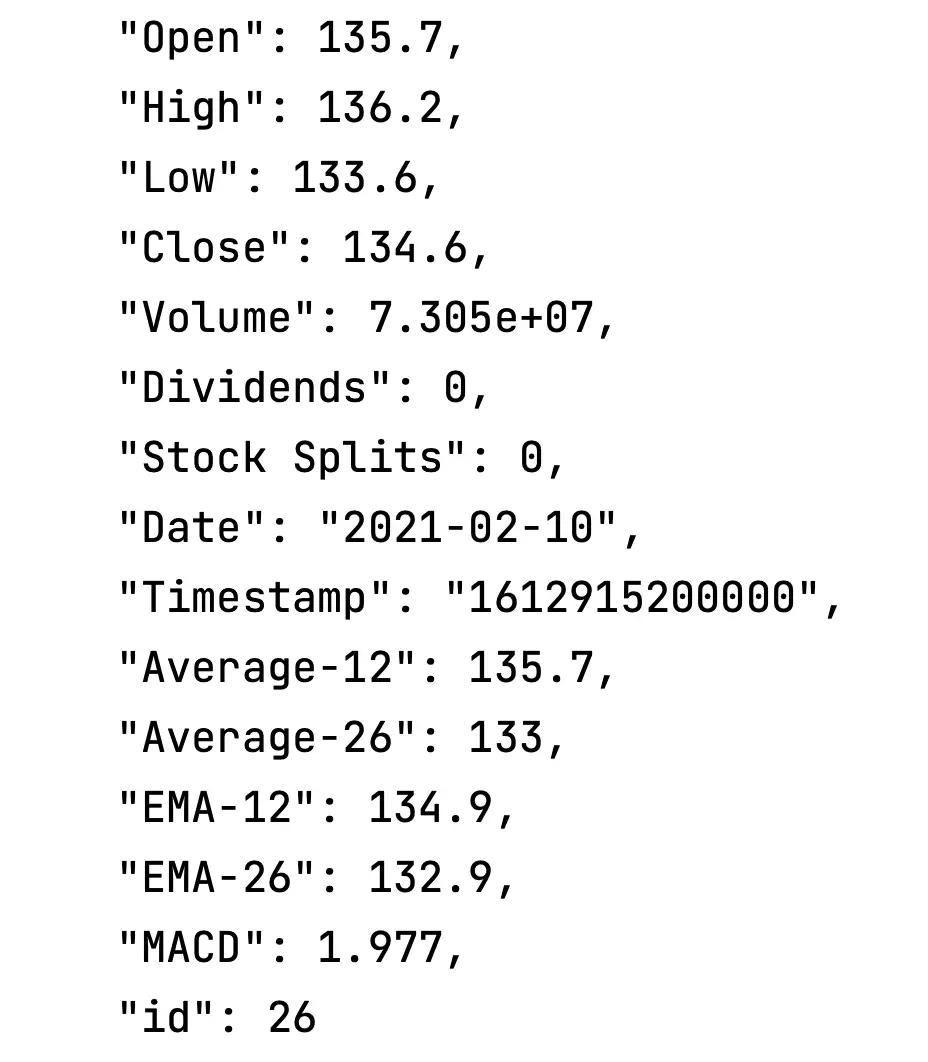
The C++ coding project I built involves reading an input JSON file containing stock data for a company. The data includes various attributes such as open, high, low, closing prices, volume, dividends, stock splits, date, and timestamp. The goal of the project is to perform technical analysis on the stock data and calculate several important indicators such as Exponential Moving Averages (EMA), Simple Moving Averages (SMA), and Moving Average Convergence Divergence (MACD).
EMA-12 (12-day Exponential Moving Average): The EMA-12 is a weighted moving average that gives more importance to recent data points. It is calculated by taking the weighted average of the previous 12 days' closing prices, with more weight given to the most recent data points.
SMA-12 (12-day Simple Moving Average): The SMA-12 is a simple average of the previous 12 days' closing prices. It provides a less volatile picture of the stock's price movement compared to the EMA.
EMA-26 (26-day Exponential Moving Average): Similar to the EMA-12, the EMA-26 calculates the weighted average of the previous 26 days' closing prices, giving more weight to recent data points.
SMA-26 (26-day Simple Moving Average): The SMA-26 is the simple average of the previous 26 days' closing prices.
MACD (Moving Average Convergence Divergence): MACD is a trend-following momentum indicator that calculates the difference between the 12-day EMA and the 26-day EMA. It helps identify potential buy or sell signals based on the crossover of these two moving averages.
Signal (Buy or Sell): The signal indicates whether it is a buy or sell recommendation based on the MACD indicator. It can be determined by analyzing the crossover of the MACD line and the signal line.
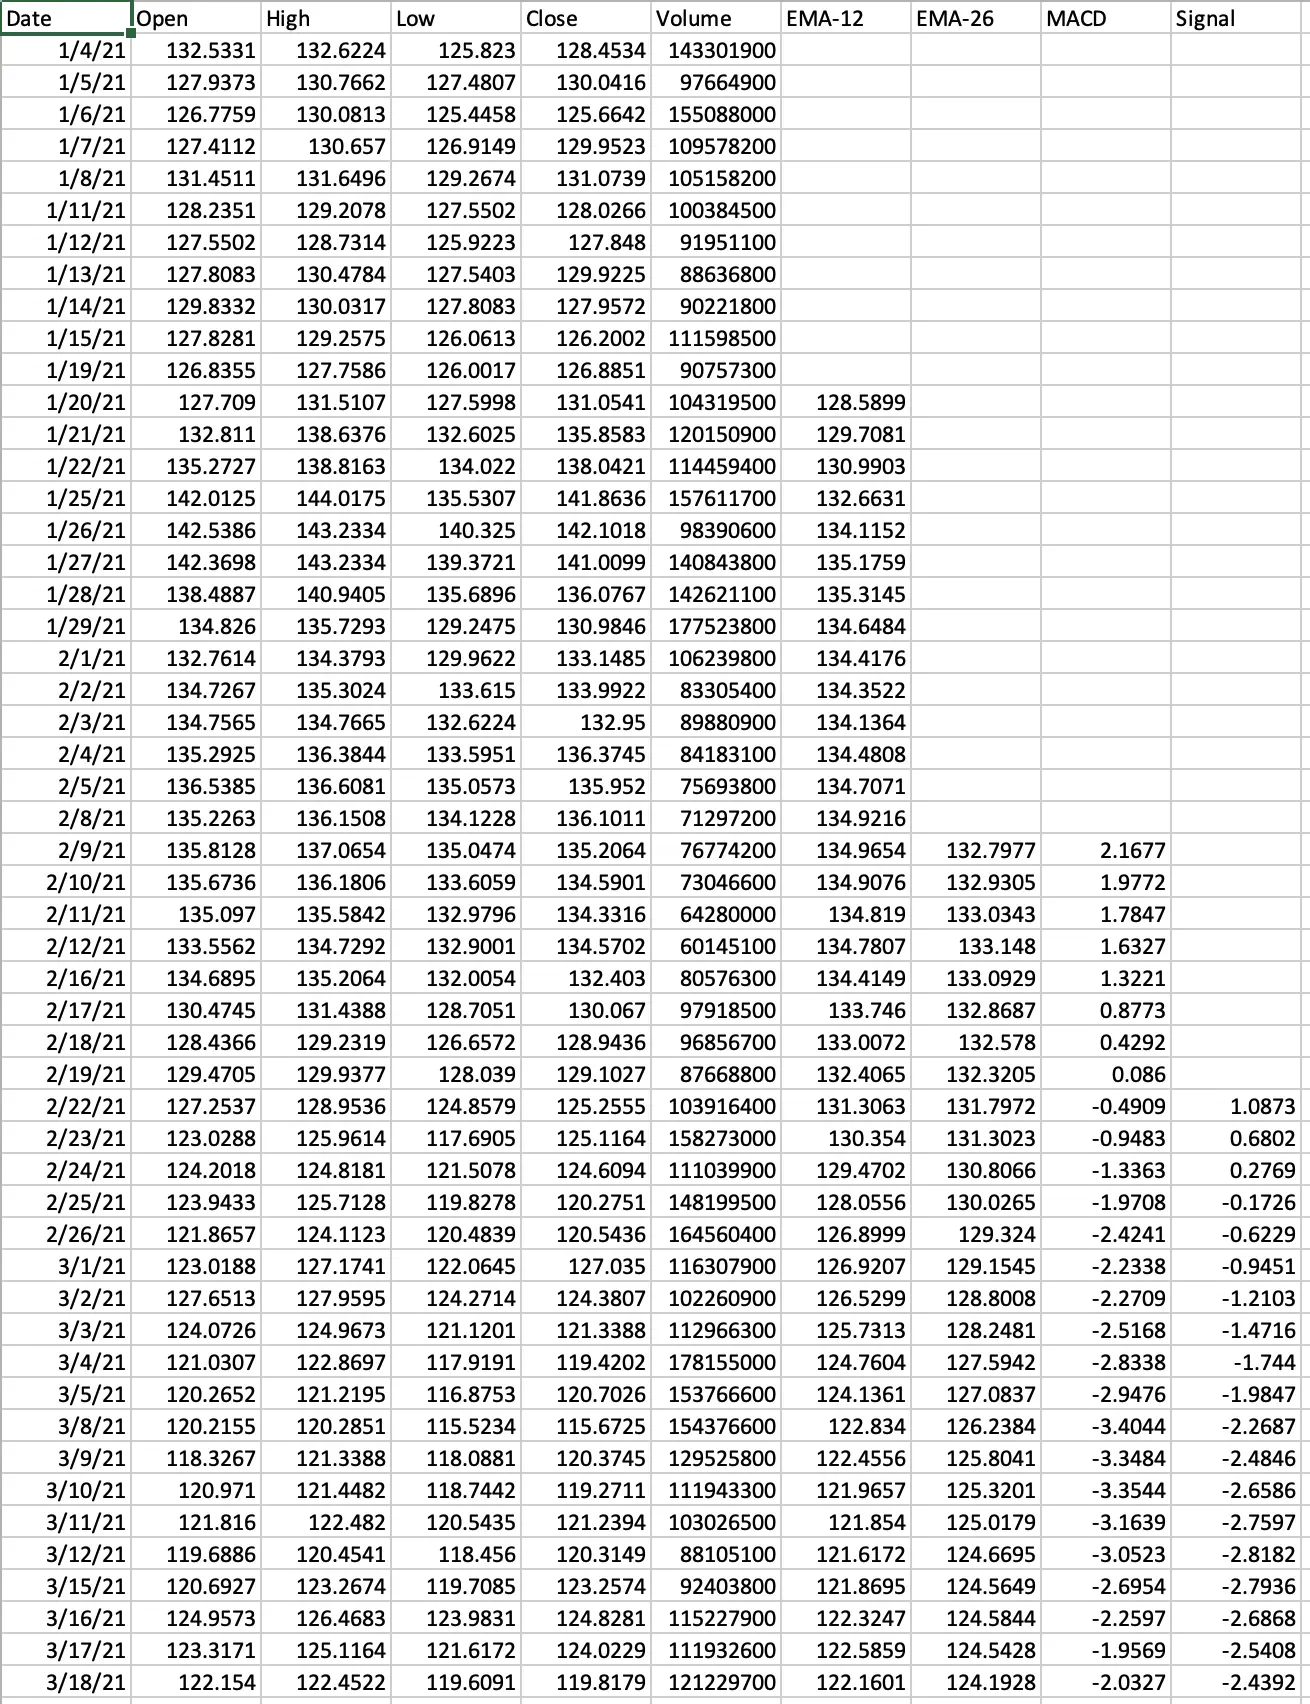
After calculating these indicators, the project outputs the data in a CSV file format, which can be easily imported and analyzed in software such as Excel. This allows for further analysis and visualization of the stock data and the calculated indicators.
Overall, this project provides a convenient and efficient way to analyze and interpret stock data using moving averages and MACD, enabling users to make informed investment decisions.
Small Input Sample:

Simplified Output:

Large Ouput:
